WARNING: the files produced do NOT share publicly. Share only privately with the Development Team.
In the world of complex software development, even with a highly skilled and meticulous Development Team like ours, when it comes to extremely complicated pieces of technology such as GRIDNET Core - unforeseen issues can arise, potentially leading to crashes.
These rare occurrences are opportunities for us to further refine our product. By following this guide, you can aid our team in swiftly pinpointing and addressing the root causes of any crashes.
This process involves utilizing Microsoft’s Debug Diagnostic Tool, a powerful and official utility, to gather detailed data from GRIDNET Core during these critical moments. Your contribution in collecting and sharing this data is essential for our continuous efforts to enhance GRIDNET Core’s reliability and performance, ensuring the highest quality experience for all users.
To set up the Debug Diagnostic Tool for GRIDNET Core, follow these steps:
-
Download and Install: Acquire Debug Diagnostic Tool v2 Update 3.2 and install it.
Download directly from Microsoft: https://www.microsoft.com/en-us/download/details.aspx?id=
-
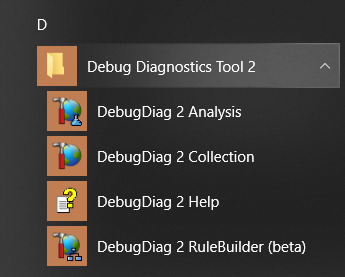
Launch DebugDiag 2 Collection: This will prompt you to create a rule.

IMPORTANT: Update first if update available just as shown below:
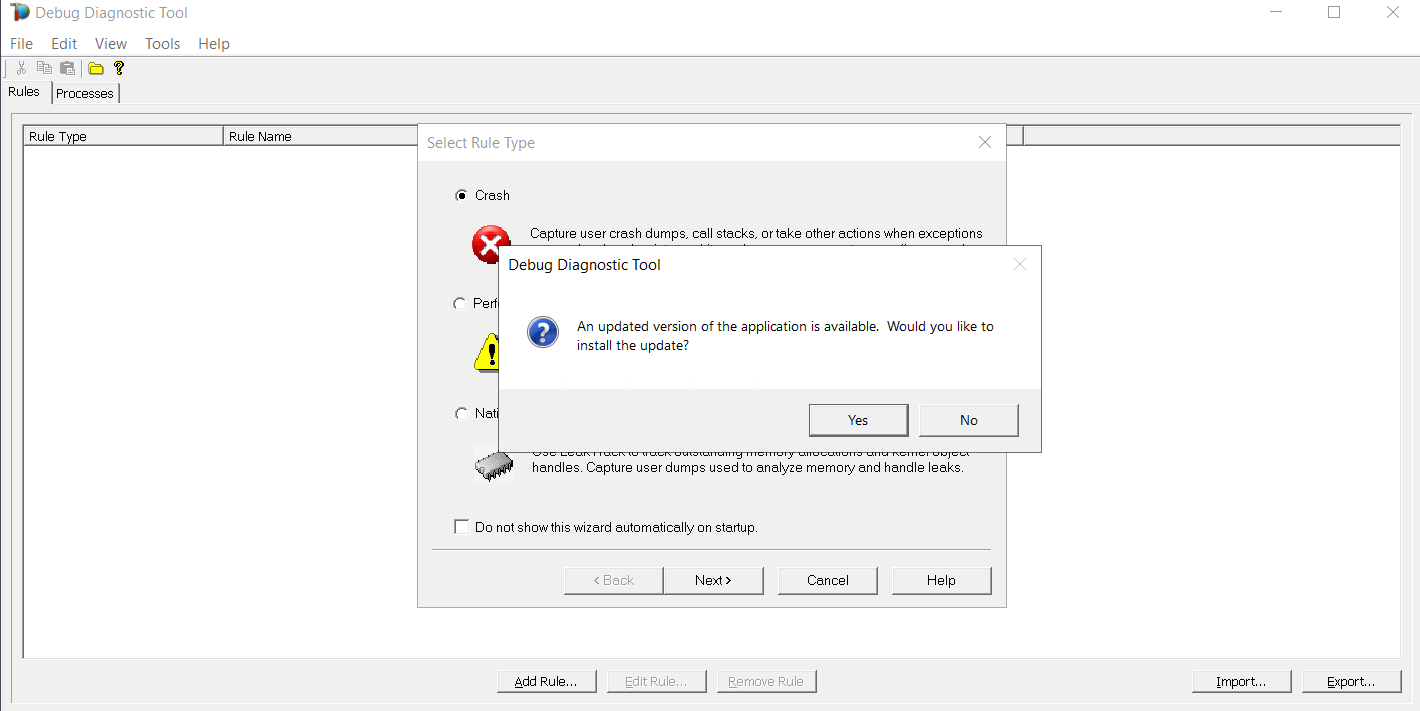
Choose yes. Download new version and begin anew.
-
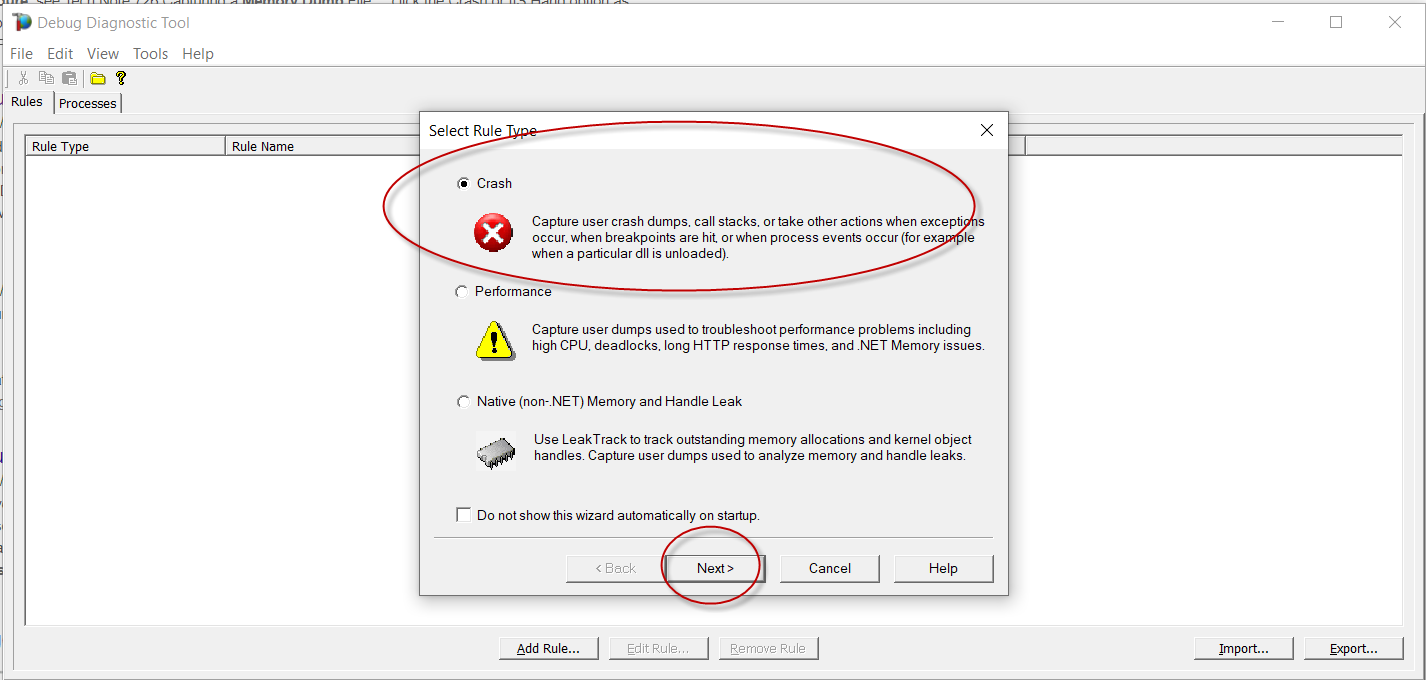
Create Rule: Select ‘Crash’ for the type of rule.
-
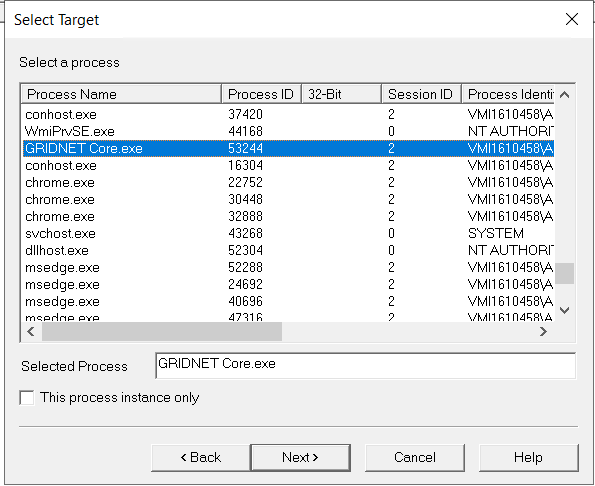
Choose Process: Opt for ‘A specific process’ and select “GRIDNET Core.exe” on next screen (as shown on second screenshot down below ).
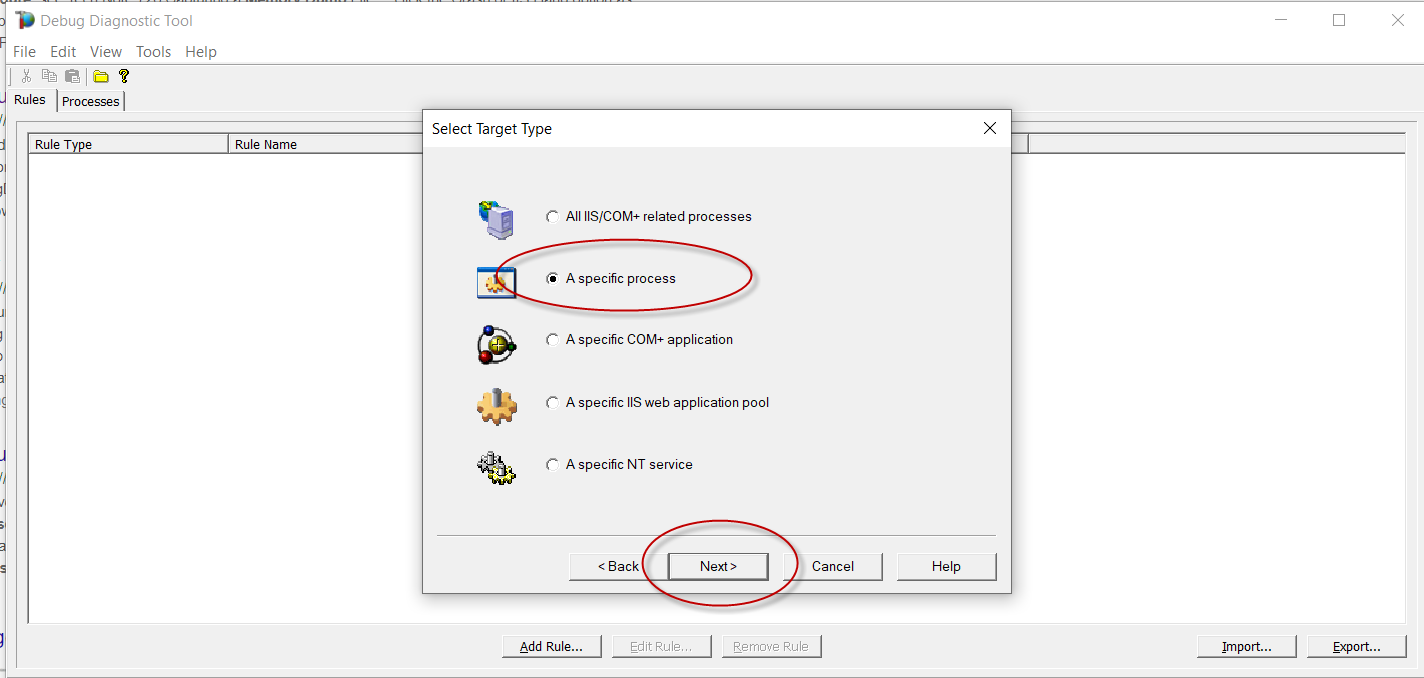
Press next and select 'GRIDNET Core.
-
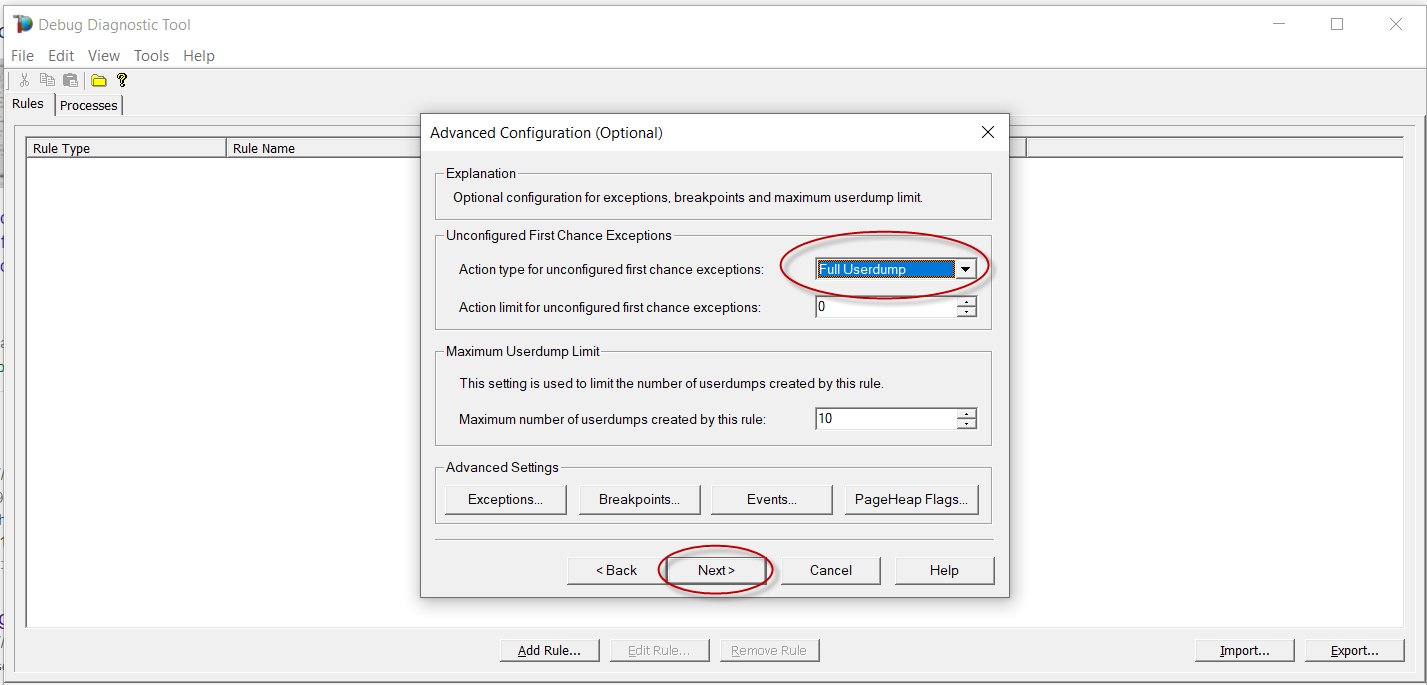
Action Type: Select ‘Full UserDump’ for first chance exceptions.
-
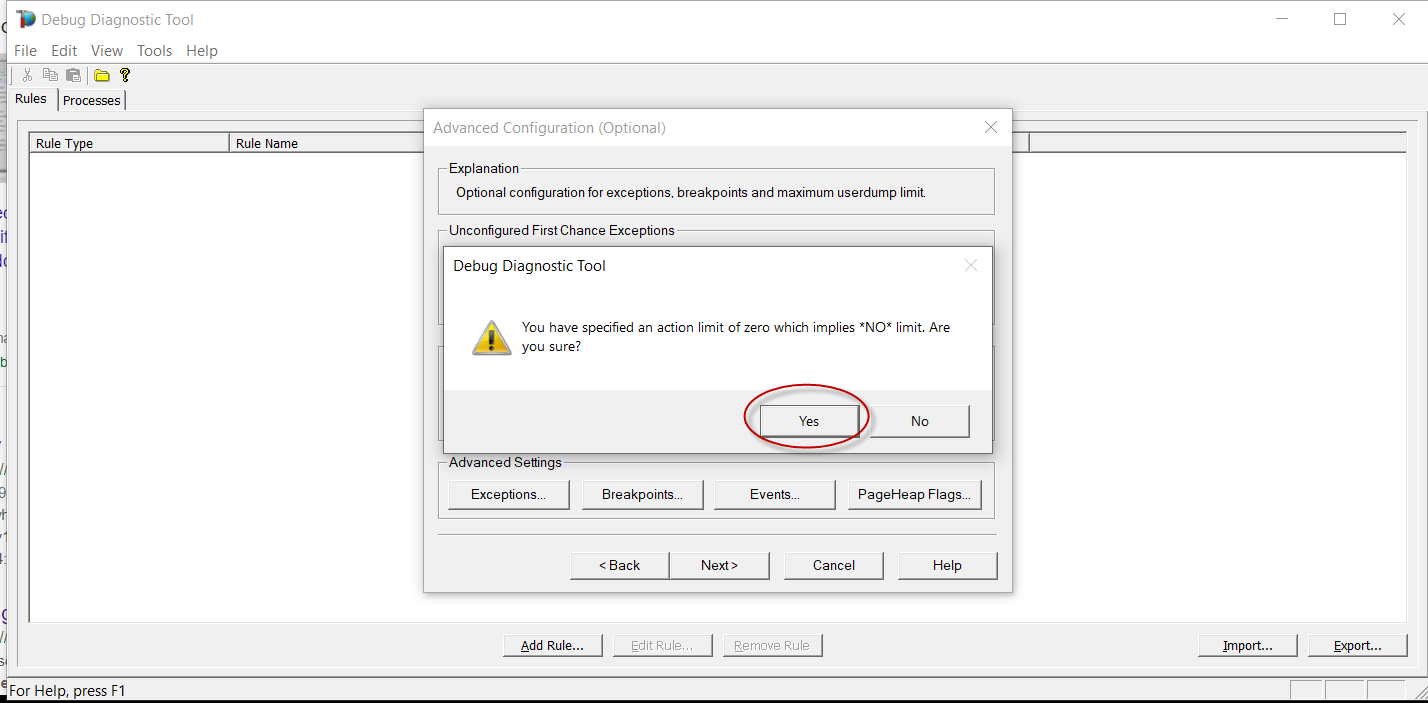
Confirmation: Click ‘Yes’ to proceed.
-
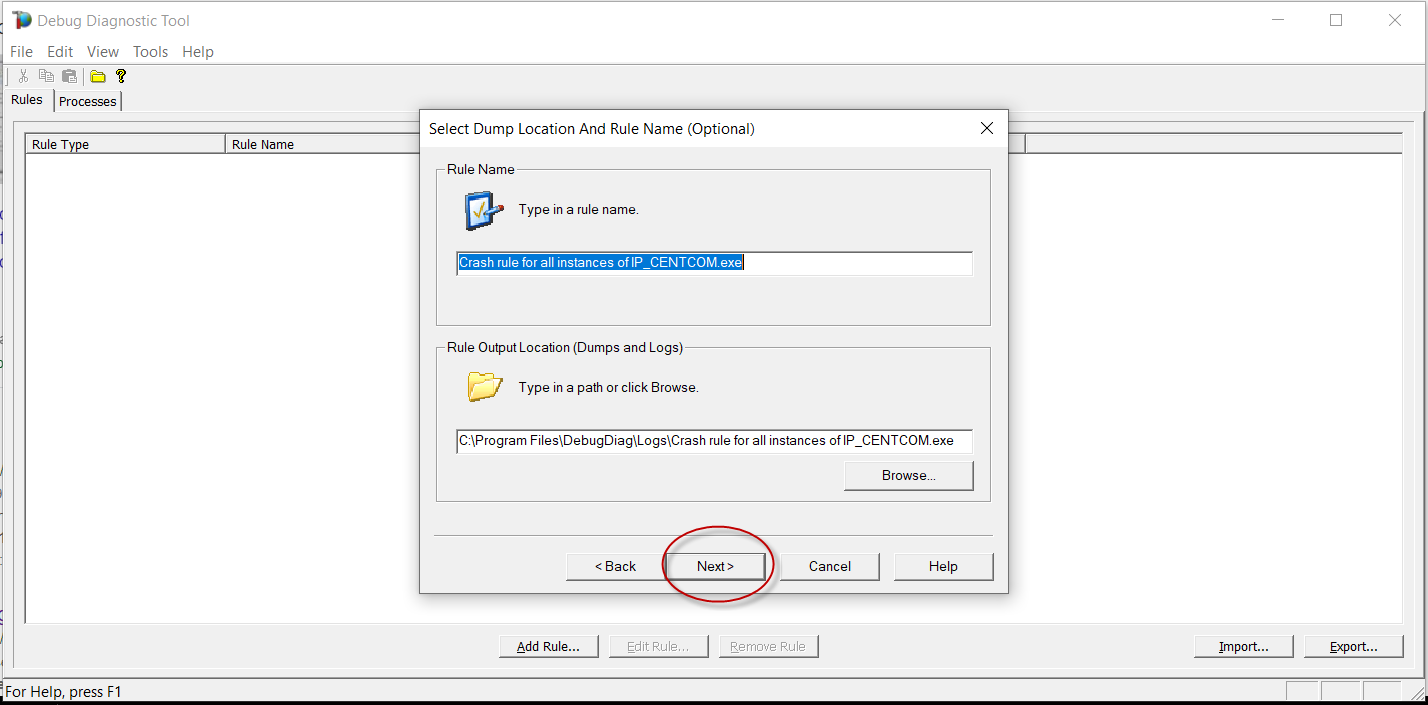
Rule Name: Accept the default name or enter a new one.
-
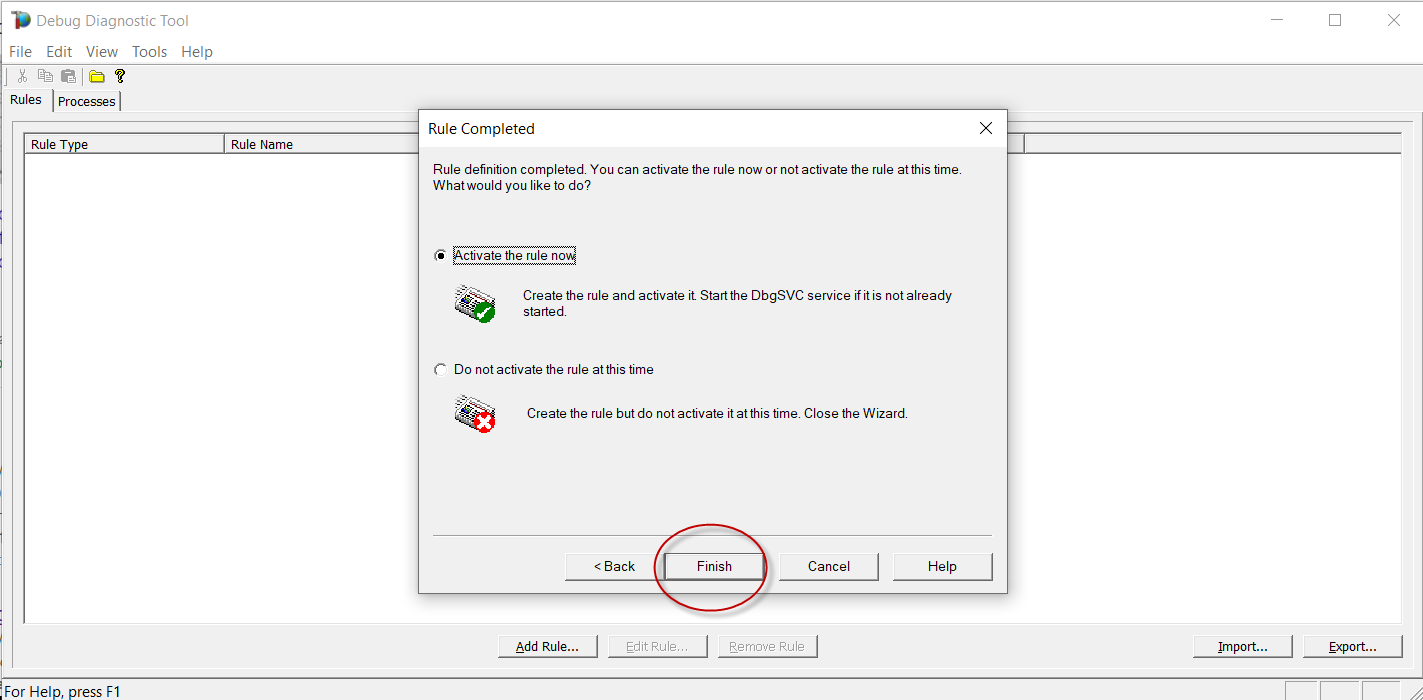
Activate Rule: Choose to activate the rule now.
-
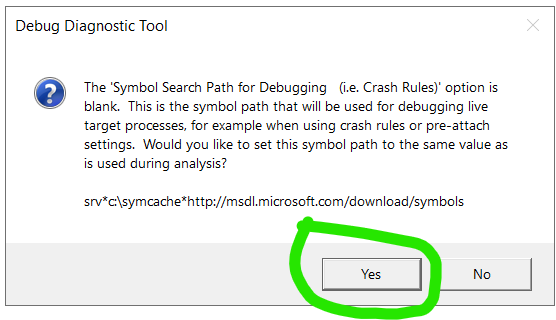
Answer YES to question below.
-
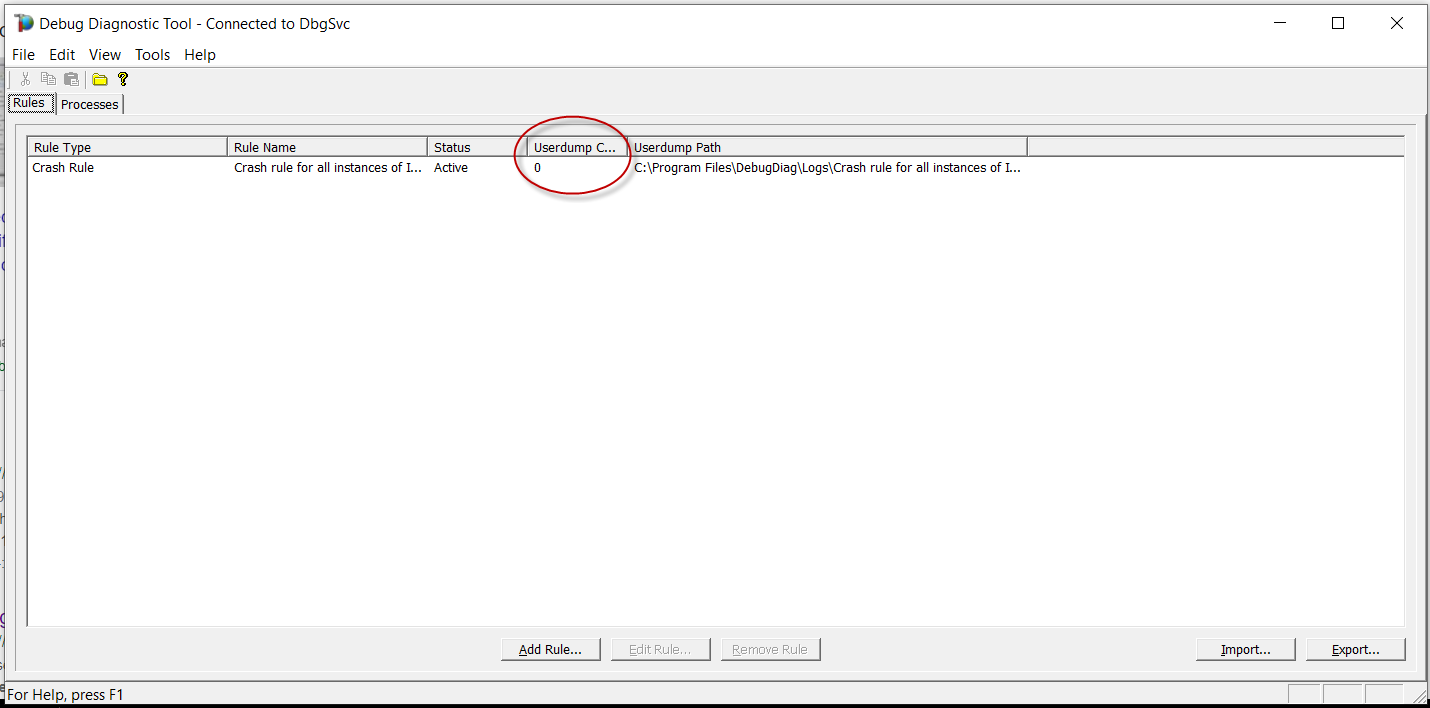
Monitor Userdump Count: It will increase with each crash or reach a set maximum.
-
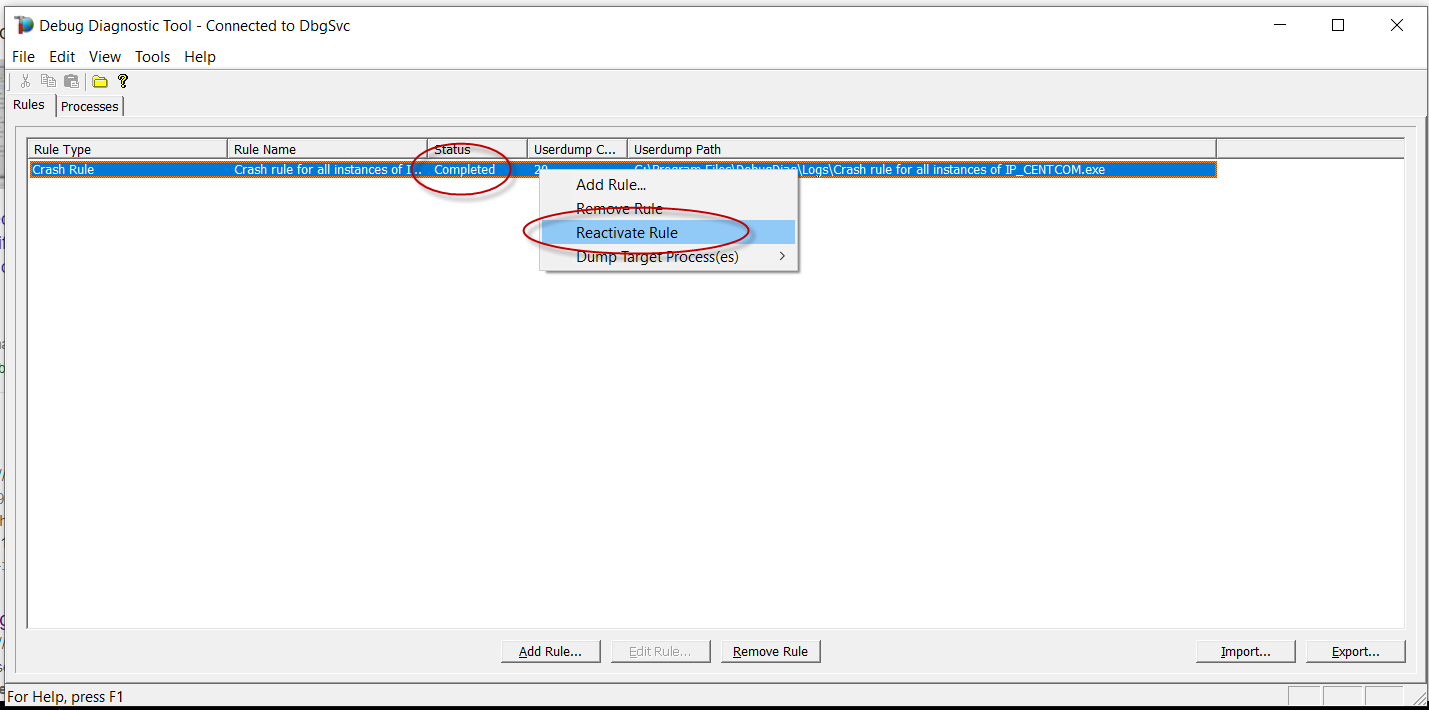
Complete Collection: If the count maxes out without a crash, restart the process.
-
File Sharing: Use https://talk.gridnet.org/t/gridnet-secure-upload-portal-military-grade-file-transmission-system-now-live/ to share the latest dump file, focusing on those with ‘Second_Chance_Exception’. Do not share dump files with anyone else. These may contain sensitive information. Use only https://upload.gridnet.org - it was designed to offer military class end-to-end encryption and resumption capabilities during the entire upload process.
-
Cleanup: Delete dump files after analysis to free up storage.
By following the provided instructions for using the Debug Diagnostic Tool with GRIDNET Core, you’re not just troubleshooting — you’re joining a pioneering endeavor to develop GRIDNET OS, the first decentralized operating system. Your contributions, through data collection and sharing, are invaluable. They don’t just help resolve immediate issues; they propel the evolution of GRIDNET OS, making it more robust and efficient.
WARNING: the files produced do NOT share publicly. Share only privately with the Development Team.
This is your chance to be part of a groundbreaking journey in technology, where every piece of data and every user plays a crucial role in shaping the future of operating systems.